

Humor in Inventory
Counting stock is genuinely funny sometimes, in a way that only people who've done it understand. We've been adding comics to the Yuneva site — real scenarios, not clip art of smiling warehouse workers. If you've ever sworn at a cycle count, some of these will hit close to home.

3PL vs. 4PL vs. 5PL: A Quick Cheat Sheet
The 3PL/4PL/5PL labels get thrown around a lot, often by people selling something. Here's what each one actually means for the person running the operation. No consulting jargon, just the practical difference.
Within Acceptable Variance
When "Within Tolerance" Means "Whatever Doesn't Wake Me Up"


Six Red Flags When Choosing a 3PL Partner
Picking the wrong 3PL doesn't announce itself — it shows up in missed SLAs, surprise fees, and inventory that doesn't reconcile. Most of the warning signs are there before you sign, if you know where to look. Here's what to watch for before you hand someone else the keys to your stock.
The Hidden Costs of 3PL Partnerships Nobody Talks About
Everyone talks about the per-pallet storage rate when they're vetting a 3PL — almost nobody talks about what bleeds out quietly after the contract is signed. This is what that actually looks like.


Before You Sign That 3PL Contract, Ask These Questions
Every 3PL contract has the same four pages of clean language up front and the real terms buried in Schedule B. The questions that matter aren't about rate cards. They're about how a pallet is defined, who eats a mis-pick, and what "cycle count" actually means in practice. If the answer is vague, the invoice won't be. Ask the boring questions before you sign. You'll ask them later anyway.
Hybrid Logistics Models: Mixing In-House and Outsourced Ops
Hybrid logistics looks clean on the org chart. A line goes here, a line goes there, everyone has a swim lane. On the floor it's two people staring at a pallet of SKU 4999-A trying to remember which contract amendment covers variants. The variance report at month-end isn't a number — it's a negotiation. Nobody's lying. The rules just live in six places, and none of them agree.


How to Transition from In-House Warehousing to 3PL Without Losing Visibility
Handing your inventory to a third-party logistics provider is one of the riskier operational moves you can make, and most of the risk isn't in the contract. It's in the gap between what your 3PL's WMS shows and what's actually on the shelf.
Cold Chain 101: A Beginner's Checklist
Every cold chain SOP I've ever read is beautiful. Every cold chain operation I've ever walked is held together by one guy named Dale who knows which thermometer actually works. The checklist on the wall and the checklist in people's heads are usually two different documents. The second one is longer.

.png)
Five Products That Absolutely Need Cold Chain (Beyond Food)
Most people think cold chain starts and ends at groceries. It doesn't. Pharmaceuticals, biologics, chemicals, cosmetics, and film all need temperature control — and one bad count can cost you the whole batch.Here's what's actually at stake when cold chain inventory goes wrong.
Temperature Excursion Alerts: What to Do in the First 15 Minutes
The first 15 minutes of a temperature excursion are supposed to be a procedure. In practice they're a scavenger hunt for the binder, the SKU list, and a probe that agrees with the sensor. By the time anyone's ready to act, the window's closed and the paperwork starts.


Vaccines, Ice Cream & Flowers: What They Have in Common
Cold chain doesn't care what's in the box. A vial of mRNA, a pallet of Ben & Jerry's, and a shipment of Dutch tulips all want the same thing: a tight temperature window, FEFO rotation, and a logger that didn't flatline somewhere between Rotterdam and your dock. The SKUs look nothing alike on the invoice. On the warehouse floor they're the same problem.
E-Commerce Warehouses Need a Different Layout Than You Think
A B2B warehouse running ecommerce orders is just a really long hallway with a scanner at the end. The racks were built for pallet pulls. The orders are now one lipstick and a phone case. Nobody's getting budget to retrofit, so the picker walks. And walks. The layout problem isn't a layout problem. It's a decade of decisions that nobody wants to undo.


Seven Ways to Reduce Warehouse Staff Turnover
Cold chain doesn't care what's in the box. A vial of mRNA, a pallet of Ben & Jerry's, and a shipment of Dutch tulips all want the same thing: a tight temperature window, FEFO rotation, and a logger that didn't flatline somewhere between Rotterdam and your dock. The SKUs look nothing alike on the invoice. On the warehouse floor they're the same problem.
Six Warehouse Tasks You Can Automate This Quarter
Every quarter a deck shows up with six tasks to automate. Cycle counts. Put away. Replenishment. ASN matching. The list is always good. The problem is never the list. The problem is the slot the WMS swears holds 400 units is actually a fire extinguisher, and we've been picking from it on paper since March. Automate the data first. Then automate the tasks.

Returns Rate Benchmarks by Industry
Every benchmark deck I've ever seen has the same chart: a tidy industry average, and a tidy little dot showing the company landing right on it. Nobody asks how the dot got there. The dot got there because someone in receiving stopped scanning returns at lunch. The benchmark isn't wrong. It's just measuring what got counted, not what came back.
ERP vs. WMS vs. IMS: Who Does What?
ERP knows what you own. WMS knows where it is. IMS knows what's actually on the shelf. In theory. In practice, each system has its own version of the truth, and the right answer depends entirely on whose meeting you're in. Finance gets one number. Ops gets another. The picker holding the box gets a third. Nobody's lying. They're just all looking at slightly different timestamps.


Fraud in the Warehouse: How to Spot It Before It Spots You
Warehouse fraud is rarely a mystery. It's usually a person, a pattern, and a process that lets both go unchecked. The hard part isn't spotting it. The hard part is that someone usually did spot it, two years ago, and nothing happened. If your adjustments, voids, and overrides all trace back to the same login on the same shift — that's not a coincidence.
The Warehouse Labor Shortage: Causes, Costs, and Solutions
Every warehouse I talk to has the same staffing math. Open reqs up. Starting wage up. Turnover up. Throughput somehow unchanged. The slide deck about solving it keeps getting older. The people running the floor keep getting tireder. At some point 'labor shortage' stops being a crisis and just becomes the operating model.


Single-Channel to Omnichannel: The Inventory Nightmare Nobody Warned You About
Nobody tells you the truth about going omnichannel: you don't get one pool of inventory, you get seven versions of the same SKU disagreeing with each other in real time. The boxes haven't moved. The math has.
Voice-Picking Technology: 5 Quick Wins
Every voice-picking pilot deck I've seen has the same five bullet points. Every floor I've walked has the same five workarounds. The tech isn't bad. The "quick win" framing just skips the part where humans have to live inside it for ten hours a day. Ask the pickers before the second slide.


Audit Season Checklist: Are You Ready?
Every year, the same checklist. Every year, the same answers. Every year, a slightly different tarp. Audit season doesn't reveal what's broken. It reveals what you've gotten good at hiding. The variance is still there in February. The auditor just isn't. If your prep involves the phrase 'don't open that bin,' you already know.
Building a Unified Inventory View Across ERP, WMS, and E-Commerce
Every unified inventory project starts with a slide that says 'single source of truth.' By month three, you've got three sources, a spreadsheet that reconciles them, and a person whose entire job is now that spreadsheet. The number you trust is the number the auditor is currently looking at.


Incoterms Cheat Sheet: FOB, CIF, DDP Explained
Three letters on a PO, six hours on the phone with the broker. Every warehouse has the same moment: a container shows up, nobody can find the Incoterm in the email chain, and suddenly it's a philosophy debate at the dock door. FOB, CIF, DDP — they all sound clean in the textbook. They get messy at 7am with a driver waiting. If your team can't tell you who owns the freight at which mile, that's not an Incoterms problem. That's a paperwork problem pretending to be a logistics one.
Nearshoring vs. Offshoring: The Great Supply Chain Rethink
Every 18 months there's a new word for the same supplier list. Offshoring became nearshoring became friend-shoring became whatever the next earnings call needs. Meanwhile receiving sees the same container, the same defect rate, and the same lead time. The map changed. The pain didn't. If you're going to rethink the supply chain, at least rethink what you're measuring.


How to Onboard a Temp Worker in Under 2 Hours
Every warehouse has a two-hour temp onboarding. Forms, a safety speech, a scanner demo, and then you release them into 40,000 SKUs and hope. The real onboarding happens in the break room, from whoever's been there longest, in sentences that start with "don't trust the slot label." That's the documentation. That's the SOP. We're not sure that's a problem you can solve with a checklist.
Peak Season Prep: A 90-Day E-Commerce Fulfillment Playbook
Every peak season starts with a 90-day plan. Most of them get about nine days of actual execution before reality takes over — a container shows up early, marketing moves a date, someone sells the safety stock on a Tuesday. The plan isn't wrong. The plan just assumes nothing else happens for three months. Something else always happens for three months.


AS/RS vs. AMR vs. AGV: What's the Difference?
Every vendor deck has this slide. AS/RS, AMR, AGV, all photographed from the same angle, all promising 30% labor reduction. On the floor nobody uses the acronyms. It's the cart, the crane, or the thing that beeps when you stand near it. The people picking 400 lines a shift don't care what SLAM stands for. They care whether it gets out of the aisle. Buy the one that fits your actual flow, not the one with the best slide.
Insurance Claims on Lost/Damaged Stock: A Checklist
Every warehouse has a claims folder. Every claims folder has a story the form can't hold. The damage was specific. The cause was specific. The number of units was almost specific. By the time it's in the portal, it's a checkbox next to "other" and a photo of a pallet from four angles that nobody will ever open. The checklist isn't the problem. The checklist is just where the truth goes to get smaller.

Seven Compliance Red Flags Auditors Look For
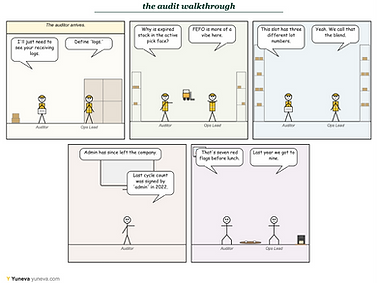
Audit week has a rhythm. The auditor points, you shrug, somebody mentions a person who left in 2022, and everyone agrees to circle back after lunch. The red flags are never a surprise. They're the same ones from last year, plus one new one because someone got creative with a pick face. If your audit prep is mostly remembering what 'admin' used to do, that's the finding.
Goods-to-Person vs. Person-to-Goods: A Cheat Sheet
Every G2P pitch deck has the same chart: a tidy line going up and to the right. Every P2G ops floor has the same chart: a tired guy named Dave who knows which slot is broken and quietly skips it. The automation question isn't G2P or P2G. It's whether the system knows what Dave knows.


Preparing for Your First External Inventory Audit: A Step-by-Step Guide
Every vendor deck has this slide. AS/RS, AMR, AGV, all photographed from the same angle, all promising 30% labor reduction. On the floor nobody uses the acronyms. It's the cart, the crane, or the thing that beeps when you stand near it. The people picking 400 lines a shift don't care what SLAM stands for. They care whether it gets out of the aisle. Buy the one that fits your actual flow, not the one with the best slide.
Six Things That Delay Customs Clearance (and How to Avoid Them)
Every customs delay article lists the same six things. Wrong HS code. Mismatched invoice. Missing certificate of origin. Vague descriptions. Random exam. Late duty payment. The articles never mention the seventh thing, which is that by the time the container clears, the PO it was attached to has already been cancelled, re-sourced, or quietly forgotten about by someone who left the company. Anyway. Tuesday.


Legacy Systems in the Warehouse: Migrate, Modernize, or Leave Alone?
Every warehouse has one. The system nobody wants to touch, nobody fully understands, and nobody can replace without an eighteen-month project plan and a small fortune. So we modernize the edges. Add a portal. Wrap an API around it. Pretend the AS/400 in the back isn't quietly running receiving for half the network. Gary, wherever you are, thank you for your service
SOX, GAAP, IFRS: A Quick Primer for Inventory Managers
Every customs delay article lists the same six things. Wrong HS code. Mismatched invoice. Missing certificate of origin. Vague descriptions. Random exam. Late duty payment. The articles never mention the seventh thing, which is that by the time the container clears, the PO it was attached to has already been cancelled, re-sourced, or quietly forgotten about by someone who left the company. Anyway. Tuesday.


BOPIS, BORIS, and Ship-from-Store: A Cheat Sheet
BOPIS, BORIS, Ship-from-Store. Three acronyms, one inventory pool, and a website that doesn't know the last unit got picked up by a customer six minutes ago. The omnichannel cheat sheet is the easy part. The hard part is that every channel reads from the same number, and that number is usually wrong. If your store associates have stopped trusting the system and started walking the floor before confirming orders, you already know which acronym is the real problem.
Pay-for-Performance Models in Warehousing: Pros, Cons & Real Examples
Pay-for-performance always shows up as a clean slide. Units per hour, a multiplier, a bonus tier. Sign here. Then the floor reads the formula and optimizes against it. Small SKUs first. Skip the pallet picks. Mispicks become someone else's KPI. Three quarters in, you're rewriting the rules faster than the pickers can game them. It's not that incentives don't work. It's that they work exactly as written, and what's written is usually a draft.


API vs. EDI: Which Integration Wins in 2026?
Every year someone declares EDI dead. Every year the VAN invoice shows up anyway. APIs are great where they exist. But the 856 ASN isn't going anywhere as long as the big retailers still want it that way, and "integration strategy" mostly means running both stacks and paying two vendors. 2026 won't be the year one wins. It'll be the year we admit that.
The Tariff Wars' Impact on Inventory Strategy
Every inventory strategy deck I've seen in the last two years has a slide labeled 'resilience.' Behind that slide is a warehouse manager who has bought, sold, re-bought, and marked down the same SKU three times. Just-in-time became just-in-case became just-buy-everything became just-guess. The forecast model isn't wrong. It's just downstream of a press conference. The strategy is the whiplash.


How can logistics transport improve delivery efficiency?
Every logistics efficiency initiative I've seen starts with a 40-slide deck and ends with a driver quietly explaining that the truck is loaded backwards. The answers are usually on the dock, not in the boardroom. They're just not billable.
The item marked wrong that nobody notices until production
A mislabel at receiving is cheap. A mislabel found on the production line is a shift, a shipment, and a very quiet meeting. The uncomfortable part isn't that it happened. It's that four different people scanned it, confirmed it, and moved it — because the label agreed with itself the whole way down. What's the furthest a wrong label has traveled in your operation before someone caught it?


The Hidden Costs of Spreadsheet-Based Inventory
The spreadsheet is free. The 20 minutes it takes to open isn't. The picker standing in front of a slot that says 40 but holds 6 isn't. The macro nobody understands because the person who wrote it retired three years ago definitely isn't. Every warehouse I've walked has one of these master sheets. Everyone knows it's the source of truth and also knows it's wrong. Both things are true at the same time, and somehow that's fine until the auditor shows up.
What is supply chain management, and how does it work?
Every new hire gets the textbook answer on day one. Plan, source, make, move, deliver. Clean, five verbs, fits on a slide. By week two they've met the PO that doesn't match the truck, the slot that doesn't match the system, and the swap someone made in 2022 that nobody wrote down. The job isn't running the chain. It's reconciling what the plan, the WMS, and the floor each insist is true. Supply chain management is mostly deciding which version of reality gets to be reality today.


The spreadsheet that breaks the day you add a second sales channel
Every growing brand has The Spreadsheet. It started as a stock tracker in 2019, and now it runs payroll adjacent to reality. Then someone says "let's add a second channel." And that's the day you find out how many things were quietly held together by column D. The spreadsheet doesn't scale. Richard doesn't scale. Something's got to give, and it's usually Richard's weekend.
What is a supply chain innovation?
Every year there's a big innovation initiative. Every year the pickers are still working around the same broken scanner at bin 47. The gap between the boardroom definition of innovation and the pick-aisle definition of innovation is roughly the length of the warehouse.


Counting in two units at once: piece count and weight-based inventory
Every warehouse that counts in two units of measure eventually learns the same thing: the scale and the scanner will not agree, and the conversion factor becomes a load-bearing lie. Somewhere in your item master there's a 0.51 lb/EA that was set by someone who no longer works there. It's holding up your entire inventory valuation.
300 sales a day and a stock count from last Tuesday
Every ops team I've talked to has a version of this. The count is a week old. Sales don't slow down while you wait for the next one. By Friday the WMS is describing a warehouse that stopped existing on Wednesday. The fix isn't counting more often out of guilt. It's counting the things that move, when they move, and trusting the number afterwards.

How can food businesses reduce supply chain inefficiencies?
Every food supply chain deck has the same five bullet points. Better forecasting. Tighter FIFO. Cold chain visibility. Supplier scorecards. Data-driven decisions. Meanwhile the truck showed up with 19 pallets of lettuce and two of them are already leaking onto the dock. The gap between the slide and the floor is where most of the waste actually lives.
Returns processing that doesn't wreck your inventory accuracy
Returns are the part of the warehouse nobody wants to own. They come in dirty, half-labeled, sometimes without an RMA, and they sit in a tote until someone braver than you decides what shelf they belong on. Meanwhile the WMS quietly rots. Your cycle counts drift. And by Q4 nobody remembers what the variance actually was. The fix isn't a bigger returns team. It's making the returns process a real process, with real statuses, on the day the tote lands.


Why is supplier screening important in global supply chains?
The supplier's website was beautiful. The pallet is on fire. These two facts are related.
Supplier screening is one of those things that feels bureaucratic until the day it very much doesn't. A phone call, a reference check, a factory visit — cheap compared to what shows up on the dock otherwise.
How can third-party logistics help food brands focus on growth?
Every food founder I've met has a version of the same story. They started because they loved the product. Then one day they realized they'd spent the whole quarter arguing with a lift-gate driver and hadn't touched a recipe in weeks. A good 3PL isn't just outsourced storage. It's the thing that lets the founder go back to being a founder. Lot codes, temperature zones, FIFO, chargebacks — someone else's problem now. The growth doesn't come from the 3PL. It comes from getting the founder's brain back.


Why Last-Mile Delivery Delays Still Happen
We can pinpoint a package from a port in Shenzhen to a sorting hub in Memphis to a van in Queens. Then the driver spends 22 minutes looking for a buzzer that doesn't work. The tracking stack is incredible. The last 400 feet remain undefeated. No amount of real-time GPS fixes a gate code nobody wrote down, an apartment number that was renumbered in 2011, or a dog. Advanced visibility is not the same as advanced arrival.
How to run a monthly inventory: the conditions and process that actually work
Every warehouse has a monthly inventory process. Most of it is written down. The parts that actually make it work usually aren't. Freeze receiving. Reconcile open transactions. Blind counts. Variance thresholds. Sign-off. On paper it's clean. In practice it's a group of people asking Dave what he did in 2019 and whether we're still doing it that way. The process works when the rules are specific, the tolerances are written, and nobody has to guess what 'closed out' means.


What is the difference between supply chain, operations, and logistics?
Every few months someone new joins and asks the question. And every time, three different people give three different answers, all correct, none matching. The org chart says these are separate functions. The missing pallet says otherwise
A year ago I'd have blamed understaffing. Now I'm not so sure
A year ago I was sure the count problems were a headcount problem. Hire two more, tighten the schedule, done. We hired. We tightened. The variance didn't move. Turns out you can staff a broken process all the way up and still land at 8%. At some point you have to admit the people weren't the bug.

Safety stock when your lead times keep lying to you
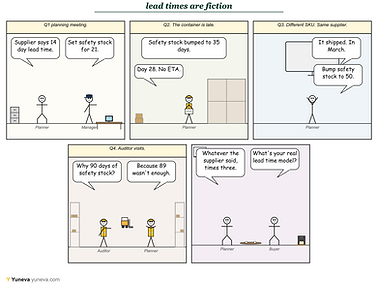
Every planner I know has two lead time numbers. The one in the ERP, and the real one they use to sleep at night. The gap between them is the size of your safety stock. And it grows every time a supplier says "next week" and means "next quarter." At some point you stop calling it planning and start calling it hedging.
Why is cold chain logistics so important for food businesses?
Cold chain isn't really about temperature. It's about the gap between what the log says and what the probe says, and what happens in the two hours you spend arguing about it on the dock. Food businesses live or die in that gap. One warm hour on a pallet of poultry doesn't show up on a spreadsheet. It shows up six days later, in a hospital, in a recall notice, in a phone call nobody wants to make. The log is a story. The product is the truth.


How is AI changing supply chain automation in manufacturing and logistics?
Every deck I've seen this year has an AI slide. Every warehouse floor I've walked this year has a corner where the AI's decisions go to die. The tech isn't the problem. The problem is deploying it on top of data nobody has cleaned since 2019, and then reporting accuracy back to the board. AI is going to change manufacturing and logistics. It hasn't changed slot A-14 yet.
Can packing slip data extraction integrate with ERP systems?
Every ERP integration conversation eventually arrives at a person. Usually named Karen. Usually with a shared inbox and a folder structure only she understands. The packing slip data does get into the ERP. It just takes a human router in the middle who nobody put on the architecture diagram. If your integration strategy has a first name, that's worth knowing.


Is a fully automated manufacturing line suitable for every factory?
Every few years a vendor walks into a 40-units-a-day shop and pitches a lights-out line built for automotive volumes. The math never works. The changeover story never fits. And Dave, who has been running the cell for 18 years, keeps hitting the number anyway. Automation is a tool, not a personality. Pick the one that matches your actual product mix.
What causes inventory discrepancies in a warehouse?
Every discrepancy has a cause. Usually four of them, stacked. Case pack changes nobody logged. Manual SKU entry when the scanner acts up. Product moved between shifts without a note. And the annual count that quietly erases all of it. The problem isn't that we don't know why inventory drifts. It's that we've made peace with it.


Finance chasing the warehouse for refund numbers that don't match
Every month, finance asks the warehouse why the refund numbers don't match. Every month, the warehouse explains that the WMS, the carrier, and the returns cart all disagree. Nobody's wrong. Nobody's right. The month closes anyway. The number you report is the number you're least embarrassed by. That's the process.
Do you think automation and AI will replace human expertise in supply chain management?
Every discrepancy has a cause. Usually four of them, stacked. Case pack changes nobody logged. Manual SKU entry when the scanner acts up. Product moved between shifts without a note. And the annual count that quietly erases all of it. The problem isn't that we don't know why inventory drifts. It's that we've made peace with it.


What does the loading and unloading of goods in logistics involve?
Every month, finance asks the warehouse why the refund numbers don't match. Every month, the warehouse explains that the WMS, the carrier, and the returns cart all disagree. Nobody's wrong. Nobody's right. The month closes anyway. The number you report is the number you're least embarrassed by. That's the process.
How is AI-powered demand forecasting transforming inventory management for modern retailers?
Every forecasting demo shows the same slide: one clean chart, one big accuracy number, one very confident vendor. The number is always true. It's just true about the 40 SKUs that were going to sell themselves anyway. The long tail — the stuff that actually breaks your slots and your receiving dock — gets a shrug and a footnote. AI doesn't fix bad history. It just repeats it faster.


What should businesses look for when choosing a warehouse fulfillment service?
Every 3PL demo has the same four slides. 99.8% accuracy. Real-time integration. Same-day dispatch. Transparent pricing. The useful signal isn't in the deck. It's in what happens when you ask a specific follow-up question — how they define a pallet, what "real-time" actually means, which cutoff makes same-day possible. The vendors who answer plainly are the ones worth shortlisting. The pitch is free. The follow-up is the interview.
Inventory Management Consulting for Manufacturers
Every quarter someone asks which consulting firm can fix excess stock, accuracy, and productivity without an ERP rip-and-replace. The answer is usually a person with a clipboard telling you to count things more often. You can pay six figures to hear it in a boardroom, or you can just start.

What are the biggest challenges companies face when scaling supply chain operations?
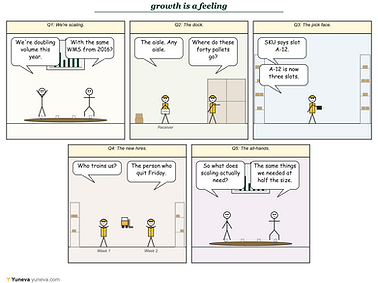
Every company I've worked with hits the same wall around 2x growth. The processes that got you here quietly stopped working about six months ago, but nobody had time to notice. Scaling isn't a new problem. It's the old problems, louder.
Peak week: when the workflow turns into “complete chaos”
Every peak week starts with a whiteboard, a wave schedule, and confidence. By Wednesday the whiteboard is a shrine to a simpler time. The plan isn't wrong. It's just that reality shows up with 40 unscheduled pallets and a pick face that doesn't match the WMS. If your team made it through this year's peak, that's the win. The debrief can wait until January.


How can logistics companies benefit from AI video analytics?
Every logistics AI pitch promises the same thing: fewer accidents, faster docks, less damage, better throughput. All true, mostly. The part nobody mentions in the demo is that once the cameras start watching, they watch everyone. Including the people your KPIs said were great. Turns out "visibility" cuts both ways.
Your ERP Isn't the Problem. Your Cycle Count Is
Every warehouse I've been in has a running feud with its ERP. NetSuite, SAP, Dynamics — doesn't matter. The ERP gets blamed for numbers it received correctly from people who counted the same overstock twice. The uncomfortable part is that most "inventory accuracy" projects are really cycle count projects wearing a costume. Fix how you count, who counted, and when they counted it, and the ERP mysteriously becomes competent again. The system isn't lying to you. It's repeating what someone wrote down at 4:47pm on a Thursday.


Ghost inventory: the stock the system swears is there
Every warehouse has a few SKUs the WMS insists exist. You've never seen them. Nobody's seen them. But there they are, quietly inflating your on-hand every Monday morning. The worst part isn't the missing stock. It's that we've all agreed to keep looking for it.
What are the biggest challenges companies face with asset tracking, and how can they solve them?
Every asset tracking program starts the same way: a spreadsheet, good intentions, and someone named Dave. By year three, you're not tracking assets. You're doing archaeology. The scanners belong to people who quit. The forklift went home with someone. The audit finds equipment in a warehouse you forgot you had. The fix isn't more spreadsheets. It's admitting the current system stopped working around the second reorg.


How is AI transforming warehouse operations?
Every deck this year has an AI slide. Every warehouse floor has a picker asking why the system just sent them through the dock door for the third time. AI in warehouse ops isn't bad. It's just that "94% confidence" hits different when you're the one unloading 4,000 units of the wrong SKU. The tech is real. The rollout is where things get interesting.
What are the benefits of AI in inventory management for retailers?
Every retail deck this year promises AI-driven inventory accuracy. The models are impressive. The training data is whatever your team typed into the WMS at 4:55pm on a Friday. AI doesn't fix a count problem. It scales one.


Which AI video analytics platform is best for manufacturing companies?
Every AI video analytics pitch sounds incredible in the boardroom. Then you deploy it, and by week two your ops lead has muted the alerts. The best platform isn't the one with the most impressive demo reel. It's the one that respects your team's attention. Signal-to-noise beats feature count every single time. If your pilot is generating 400 alerts a day and your people are triaging none of them, you didn't buy analytics. You bought wallpaper.
AI Is Changing How Companies Should Choose Supply Chain Software
Every WMS demo this year opens with a slide about AI. Half of them can't tell you what data the AI is trained on, and the other half quietly assume your inventory records are accurate. Spoiler: they aren't. The model doesn't fix that. It just puts a confidence score on top of it. Before you buy the prediction layer, fix the count layer.


What does an AI-powered logistics platform actually do better than human-managed operations?
Every AI logistics pitch I've sat through promises to predict demand, reslot the pick face, and flag anomalies before they happen. All useful. Also, all things Dave in aisle 4 has been doing quietly for eleven years without a dashboard. The interesting question isn't whether AI beats Dave. It's what happens the day Dave retires and nobody wrote down what he knew.
AI does not replace ERP - it makes ERP smarter
Every AI-in-supply-chain pitch I've sat through this year opens with "replace your ERP." Nobody replaces their ERP. The ERP outlived three CIOs and it will outlive the AI vendor too. What actually happens is smaller and more useful: the AI reads the PDF, cleans the master data, guesses the safety stock, and hands it all back to SAP. The ERP is still the system of record. It just has fewer typos now. That's not a smaller story. That's the real one.


How can warehouse fulfillment services improve delivery times?
Every AI logistics pitch I've sat through promises to predict demand, reslot the pick face, and flag anomalies before they happen. All useful. Also, all things Dave in aisle 4 has been doing quietly for eleven years without a dashboard. The interesting question isn't whether AI beats Dave. It's what happens the day Dave retires and nobody wrote down what he knew.
Why Goods-to-Person Automation is a Game Changer in Logistics
Every goods-to-person deck promises the same thing: pickers stop walking, rates triple, the warehouse hums. What the deck doesn't cover: the top-mover SKUs that still get picked manually, the shuttle jams at 10am, and the two new roles you hired to babysit the system. It's a real productivity gain. It's also not the one on the slide.


How can a business reduce excess inventory without causing stockouts?
The answer to "reduce excess inventory without stockouts" is never a single number. It's segmentation, lead-time visibility, real demand signals, and honest conversations about which SKUs actually deserve safety stock. But most of the time, it's a pendulum. Cut too hard in Q2, panic-buy in Q3, and pretend Q4 was the plan all along. The fix isn't smarter cutting. It's knowing what you actually have, per SKU, before anyone touches the reorder points.
The ERP rollout that changed how people decide before it even shipped
The strangest thing about a big ERP rollout isn't the go-live. It's what happens in the months before it, when every decision quietly bends toward a system that doesn't exist yet. Safety stock gets trimmed. Slotting gets frozen. Labels get skipped. All on the assumption that the new thing will handle it. Then the date slips, and you realize you've been operating a phantom warehouse for six months. The project didn't fail at go-live. It changed how people worked the day it was announced.


How can e-commerce sellers use AI to improve inventory and demand forecasting?
Every quarter, someone demos an AI forecasting tool that confidently predicts demand spikes in November. Groundbreaking. The real wins from AI in inventory aren't the seasonal patterns your buyer already knows. They're the boring stuff: SKU-level lead time drift, supplier variance, the slow bleed of dead stock nobody flagged. If your model's headline insight is "stock up for Q4," you didn't buy AI. You bought a calendar.
What is the biggest challenge with managing inventory today?
We asked warehouse managers what the biggest inventory challenge is today. The answers weren't tariffs, AI, or forecasting. It was the same thing it's been for twenty years: the number in the system doesn't match the number on the shelf. Every dashboard, every reorder point, every promise to a customer sits on top of that one assumption — and most of the time, nobody's checked it this quarter. You can't optimise your way out of a wrong count. You can only count again.


How do growing food businesses scale their supply chain efficiently?
Every food brand I've worked with has the same growth chart: SKUs go up, shelf life goes down, and someone in ops quietly becomes the institutional memory for what happened to lot 4471. Scaling efficiently is a nice phrase. Scaling and then fixing it in reverse is what actually happens. The brands that survive are the ones that admit it early and put real systems in before the third warehouse.
Rugged hardware for the warehouse floor: what survives the drop
Every rugged device spec sheet lists drop height, IP rating, and operating temperature. None of them list "left on the dashboard of a truck in July" or "went through the wash cycle in someone's hi-vis." That's the real test suite, and the floor writes it. The scanners that survive aren't the ones with the best specs. They're the ones the crew stops trying to kill because they gave up.


Overbuying vs underbuying: the cash-flow trade-off nobody balances well
Every buying team I've met is either recovering from an overbuy or about to cause the next underbuy. There's no steady state. There's just which side of the pendulum you're on this quarter. The volume discount always wins the argument in the room. The stockout always wins the argument six months later. And then we do it again. Nobody's actually balancing the trade-off. We're just alternating who gets yelled at.
How does AI inventory optimization reduce both stockouts and excess inventory?
Every AI inventory pitch promises the same thing: fewer stockouts AND less excess. Both. Simultaneously. Forever. In practice, the model is only as good as the data you fed it and the humans checking its outputs. A forecast that hasn't seen a demand shift, a promotion calendar, or a supplier lead-time change is just an expensive average. The wins are real. They're just quieter than the demo.


Finance chasing the warehouse for refund numbers that don't match
Every warehouse has this email thread. Finance has one number. Ops has another. Neither is wrong, exactly. They're just counting different things and nobody wrote down which was which. The reconciliation usually happens on the last day of the month, over coffee, by someone who wasn't there when the returns came in.
What is the average inventory shrinkage rate for retail and ecommerce businesses?
The retail shrinkage benchmark hovers around 1.6%. Ecommerce trends a bit higher, closer to 1.8-2%. That's the number that ends up in board decks. What it actually contains, once you pull the thread, is theft, damage, receiving errors, miscounts, and a category most teams quietly label 'unknown.' The benchmark isn't wrong. It's just doing a lot of work to feel like one number. Worth asking what your 1.6% is actually made of.


The Cheapest Supplier Can Be the Most Expensive Decision
Every warehouse has this email thread. Finance has one number. Ops has another. Neither is wrong, exactly. They're just counting different things and nobody wrote down which was which. The reconciliation usually happens on the last day of the month, over coffee, by someone who wasn't there when the returns came in.
Why your inventory results are made in the month, not on count day
Count day doesn't create your variance. It just shows you the month you already had. Every unscanned pallet, every quiet workaround, every "we'll fix it later" — those are the entries. The count is the receipt. If you want a better number in 30 days, the work is on day 4, day 11, day 19. Not the morning of.


Your Inventory Number May Be Lying to You
Every warehouse has a number that everyone quotes and nobody trusts. The WMS says one thing, the slot says another, receiving disagrees with nights, and purchasing reorders off whichever one sounds most confident. The scary part isn't the wrong number. It's how normal it feels to work around it.
How Predictive Planning Reduces Logistics Costs
Every predictive planning deck promises lower logistics costs. Every warehouse I've walked has a whiteboard of manual overrides next to the printer. The model isn't wrong. It's just not the thing making the call at 6am when a container's late and someone has to decide whether to expedite. The savings show up when the forecast, the override, and the reason are all in the same place — and someone can actually see the pattern.


Why do frequent cycle counts fail to improve inventory accuracy?
More counts, same accuracy. It's one of the strangest patterns in warehousing: teams triple their cycle count frequency and the number barely moves. The count isn't the problem. It's what happens after — or doesn't. Variances get adjusted away, root causes never get logged, and the same SKU shows up on next week's recount. You can't audit your way out of a process gap.
Ghost inventory: the stock the system swears is there
Every warehouse has a slot that shows stock in the WMS and cobwebs in real life. Everyone knows. Nobody fixes it. It quietly funds backorders and awkward customer emails for years. The ghost isn't the missing stock. It's the adjustment somebody almost made in March and then got pulled to the dock.


How should businesses manage returned inventory efficiently?
Every warehouse has a returns corner. Nobody planned it. It just... formed. The pain isn't the returns themselves — it's that they sit in a grey zone between resellable, refurbishable, and "ask Kevin." Meanwhile the WMS insists the stock is on the shelf. Pickers know better. A returns process only works if the decision — restock, refurb, scrap, vendor return — happens at receiving, not three weeks later in a spreadsheet.
How can businesses make procurement faster and more efficient?
Every procurement 'acceleration' project I've seen starts with a slide deck and ends with a new required field. The seven approvers are still there. The $600 PO still routes through the same chain as the $6M one. But now there's a justification box, so it counts as progress. Faster procurement isn't a form. It's fewer humans in the middle of decisions that don't need them.


How does a container port actually work?
Every time someone asks how a container port works, I want to hand them a diagram. Then I remember the diagram doesn't include the night-shift spreadsheet, the chassis shortage, or the appointment that got rebooked three times. The cranes and the TOS get all the credit. The people holding it together at 3am don't.
Difference Between Inventory on Paper and Inventory on the Floor
Every warehouse runs two inventories. The one on paper, and the one you can actually put your hand on. Most of the time they're close enough. Sometimes they're off by 35 units and a pallet that's been sitting in the wrong slot since a manager who no longer works here put it there. The scary part isn't the gap. It's how normal the gap feels.


Why Do Stockouts Happen When the Warehouse Looks Full?
Every warehouse manager has had this Monday. The building is packed. The dock is jammed. And somehow the top-selling SKU is at zero. A full warehouse and a stockout aren't opposites. They're usually the same problem wearing different clothes: dead stock in prime slots, mislabeled receipts, phantom quantities, and one bin called MISC doing the work of a small country. The fix isn't more space. It's knowing what's actually in the space you have.
How can AI improve warehouse management and inventory planning?
Every vendor deck this year promises AI-driven inventory planning. Very few of them ask what the AI is going to be trained on. If your on-hand numbers are off by 40% before the model runs, the model isn't a forecasting tool. It's a confidence machine. Fix the count first. Then talk to the robots.


What is the work process of online logistics company?
Every online logistics company has a five-step process on their About page. Clean icons, blue arrows, one seamless flow from click to doorstep. The real process has the same five steps. It just also has a Slack thread, a driver who left early, and a KPI definition that quietly moved last quarter. Both are true. Only one gets a slide.
Linking receiving inspection data to inventory records (so you can trace it later)
Every warehouse has this drawer. The receiving inspection happened. Someone signed something. A photo exists on a phone that has since been factory reset. Then a claim comes in six months later and you get to reconstruct history from a spreadsheet, a memory, and vibes. Inspection data that doesn't attach to the receipt, the lot, and the location isn't traceability. It's a story you tell auditors.
.png)

How can AI supply chain planning turn inventory alerts into operational actions?
Every online logistics company has a five-step process on their About page. Clean icons, blue arrows, one seamless flow from click to doorstep. The real process has the same five steps. It just also has a Slack thread, a driver who left early, and a KPI definition that quietly moved last quarter. Both are true. Only one gets a slide.
Where Does the Price of a Product Actually Come From?
Everyone assumes pricing is a formula. It's usually a formula wrapped around a decision someone made once, in a meeting nobody remembers, that has never been revisited. Landed cost is real. Margin targets are real. The $12.99 sticker is a vibe Dave had on a Thursday.


Air vs Sea: When Does Speed Become Worth the Cost?
The air-vs-sea decision is almost never a strategy conversation. It's a rescue mission for a date that slipped three weeks ago. The math is real: 10-15x per-unit cost, margin gone, and everyone at the table already knows the answer before the meeting starts. Half by air to cover the gap, rest by sea to save what's left of the P&L. Speed is worth the cost when the alternative is a stockout you can't explain to the customer. Or the boss.
How do I choose the best ERP for inventory management?
Every ERP selection I've watched follows the same arc. A 400-line requirements doc. Demos where every vendor says yes to everything. A scoring spreadsheet nobody trusts. And then a decision made in a hallway. The best ERP for inventory management is usually the one your team actually ends up working around the least. Which you find out about 18 months after signing. Pick with your eyes open. And keep the spreadsheet.


Are Your Inventory Numbers Really Accurate?
Every warehouse I've walked has an inventory accuracy number on a slide somewhere. And every warehouse I've walked has a second, quieter number that nobody puts on a slide. The gap between those two numbers is where the backorders live.
Lowest inventory isn't the goal - The right position is
Somewhere between 'too much stock' and 'no stock' there's a number that keeps the lines running and the customers happy. That number is almost never zero. Lean isn't a leaderboard. The win isn't the smallest pile — it's the right pile, in the right slot, at the right time. Everything else is just expensive air freight with a nicer name.


Your warehouse isn't slow. It's waiting
Every warehouse I've walked has an inventory accuracy number on a slide somewhere. And every warehouse I've walked has a second, quieter number that nobody puts on a slide. The gap between those two numbers is where the backorders live.
Getting off spreadsheets: what to put in place before you outgrow them
Spreadsheets don't fail loudly. They quietly become the system, and then one person goes on vacation and receiving stops. The move isn't to rip out the sheet on day one. It's to notice which tabs are now load-bearing, write down the rules that only live in someone's head, and get counts, locations, and tolerances into something that survives a Tuesday. If your operation runs on one file and one Kevin, you don't have a process. You have a hostage situation.


Why Peak Season Breaks Online Order Fulfillment
Every peak season debrief ends the same way. Someone asks what we'll change. Someone else shrugs. The forecast is wrong, the temps are green, the vendor ships to the wrong dock, and the slot count is a suggestion. None of this is new. We just re-live it every November. The struggle isn't that peak is hard. It's that we treat it like weather instead of a system.
Inventory Is Cash. Count It Right.
Every pallet on your floor is cash you already spent. Every phantom unit on the WMS is cash you can't spend again. The difference between "we have plenty" and "we have $8M frozen in slow-movers" is one honest count. Count the stock. Free the capital.


2PL vs 3PL: What’s the Difference?
Every logistics glossary defines 2PL and 3PL the same way: assets, services, contracts, scope. The real definition is operational. A 2PL is who you call when the truck is late. A 3PL is who you call when the truck is late AND the pick is short AND the ASN doesn't match. Different phone number, different 3am. Pick your partner based on which call you'd rather make.
3PL Client Portal: Key Features for Visibility
Every 3PL sales deck has a slide about the client portal. Every client, six months in, has a folder of emails to Karen. A real portal shows live inventory by SKU and lot, itemized billing you can reconcile without a phone call, and SLA performance updated more than once per quarter. If any of those three are missing, you don't have a portal. You have a login page.


Can Green Supply Chain KPIs Still Mean Lost Profits?
A dashboard full of green squares is not the same as a profitable quarter. You can hit 98% OTIF by expediting everything. You can hit 99% fill rate by sitting on inventory nobody ordered. You can hit zero stockouts by writing a very expensive cheque every Friday. KPIs measure what operations did. They don't measure what it cost to do it. When ops and finance report on different scoreboards, someone eventually notices the gap — usually the CFO, usually late. If your supply chain scorecard doesn't include a cost line next to every service line, you're not measuring performance. You're measuring effort.
Your KPI isn't wrong. It's missing context.
Every warehouse has that one metric that looks incredible on the slide and terrible in the returns bay. The number isn't lying. It's just answering a very narrow question, very confidently, while three other numbers in three other departments quietly disagree. A KPI without context is a mood, not a measurement.
